By Carole Plumb

A new report, “A Perfect Storm: Cities and Towns Face Historic Fiscal Pressures,” warns that many Massachusetts municipalities are caught between inflation-driven increases in costs and binding constraints on their ability to raise new local revenue, particularly under Proposition 2½, which is putting enormous pressure on municipal budgets.
see https://tinyurl.com/wpperfectstorm.
The report, released by the Massachusetts Municipal Association (MMA) underscores that while state spending on annual operating budgets has grown by about 2.8% annually (inflation-adjusted) from 2010 to 2022, local spending across Massachusetts cities and towns has averaged only 0.6% per year — a gap that continues to widen. U.S cities and towns averaged 1.0%.
|
Town |
FY |
Avg. |
Avg. Tax |
In 2025 adjusted $’s |
Change in $ |
Change in % |
|
Wayland |
2025 |
$1.14 M |
$17,854 |
|
|
|
|
|
2020 |
$800 K |
$14,214 |
$17,464 |
+390 |
+2.2% |
|
|
2010 |
$618 K |
$10,982 |
$13,493 |
+4,361 |
+32.3% |
|
Weston |
2025 |
$2.29 M |
$25,464 |
|
|
|
|
|
2020 |
$1.63 M |
$20,922 |
$25,706 |
-242 |
-0.9% |
|
Sudbury |
2025 |
$1.12 M |
$16,343 |
|
|
|
|
|
2020 |
$724 K |
$13,360 |
$16,415 |
-72 |
-0.4% |
|
Newton |
2025 |
$1.66 M |
$16,314 |
|
|
|
|
|
2020 |
$1.23 M |
$12,849 |
$15,787 |
+527 |
+3.3% |
|
Natick |
2025 |
$878 K |
$10,500 |
|
|
|
|
|
2020 |
$618 K |
$8,410 |
$10,333 |
+167 |
+1.6% |
|
Lincoln |
2025 |
$1.60 M |
$20,462 |
|
|
|
|
|
2020 |
$1.18 M |
$18,097 |
$22,235 |
-1,773 |
-8.0% |
|
Hopkinton |
2025 |
$917 K |
$13,007 |
|
|
|
|
|
2020 |
$656 K |
$11,196 |
$13,756 |
-749 |
-5.4% |
|
Framingham |
2025 |
$653 K |
$7,798 |
|
|
|
|
|
2020 |
$440 K |
$6,586 |
$8,092 |
-294 |
-3.6% |
|
Concord |
2025 |
$1.48 M |
$19,585 |
|
|
|
|
|
2020 |
$1.11 M |
$15,743 |
$19,343 |
+242 |
+1.3% |
Nationwide, cities and towns get about 31% of their revenue via state aid; in Massachusetts it’s 26%. State aid funding generally comes with restrictions on use. Unrestricted General Government Aid (UGGA), the Commonwealth’s primary source of local, unrestricted aid for municipal services, has been falling. It leaves municipalities with less flexibility to respond to unexpected, evolving needs. UGGA Funding is 25% lower than it was in 2002, when adjusted for inflation, according to the MMA website.
“Municipalities have been frugal, and any cuts they’re forced to make are now cutting bone,” said MMA Executive Director Adam Chapdelaine.
The Inflation Effect
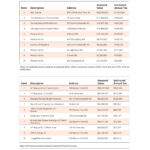
Inflation measures the change in the price of goods over time as measured in the Consumer Price Index (CPI). Downscaling the MMA methodology on inflation to the town level, the 2020 average single-family tax bill can be compared to the Fiscal Year 2025 figure, adjusted for inflation in the table that follows.
The data was sourced by MA Division of Local Services and the U.S. Bureau of Labor Statistics CPI for All Urban Consumers in Boston-Cambridge-Newton, annual averages for 2020, and monthly CPI for Oct 2025 for inflation adjusted 2010 dollars. Note that the FY2010 data uses Jan 1, 2009 values during which the country was still in recovery from the 2008 recession.
In Fiscal Year 2010, Wayland’s average single-family tax bill was $10,982 ($13,493 in 2025 dollars). Over 15 years, the tax bill increase has averaged around 2.1%. The Fiscal Year 2025 average single-family tax bill is $17,854 and over the last five years, the tax bill increase remained at 2.2% but that is with a 43% increase in the single-family homes property values after the Covid19 downturn.
After inflation, the cost of Wayland’s single-family tax bill has risen only slightly over the past five years, averaging 0.44%— despite numerous voter-approved debt exclusions for projects such as the new high school (2012 for $70.4M), DPW facility (2015 for $12.3M) and Council of Aging Community Center (2025 for $12.4M), and as well as ongoing planning for school renovations and a new MWRA water connection.
Big Projects, Tight Leash
In contrast to towns with major industrial tax bases, Wayland’s property tax burden falls almost entirely on residential owners. Proposition 2½ limits annual levy growth to 2.5% plus new growth, meaning large projects must go before voters for debt exclusions.
Recent initiatives — including design funds for school modernization, PFAS remediation at the water treatment plant, and road/culvert infrastructure improvements — have added to financial pressures even as the town works to maintain AAA bond status and healthy reserves.
Same Pressures, Local Impact
Single-family home valuations in Wayland have surged since 2010, roughly doubling from around $640,000 to $1.28 million, according to Assessors’ data. The Assessor’s and MA Division of Local Services (which shows lower values in table) differ because of timing interval, housing inclusion criteria, and data sources – Assessors include newer comps while DLS uses tax recap snapshots.
The suburban wealth effect has supported stability in Wayland’s finances until now, but it also masks the fragility described in the MMA report: rising costs for aging schools, health insurance, special education, and public works are far outpacing what the town can legally raise under Proposition 2½.
The MMA warns that many communities are approaching “fiscal cliffs” — service levels will be forced to drop or overrides will become routine. Wayland’s Finance Director Brian Keveny recently noted in public meetings that without new growth or additional state aid, the town will face structural deficits beginning in FY2026.
For towns like Wayland, which pride themselves on high-quality services and schools, local officials have repeatedly described the town’s financial outlook as “unsustainable without new growth or revenue diversification.”
While the MMA report paints a broad statewide picture and identifies key differences between urban, suburban, rural and gateway cities, the same challenges to municipal finance exist with even fewer options for the less affluent. The underlying message still resonates in Wayland: even well-managed, affluent towns are running out of room to maneuver.